

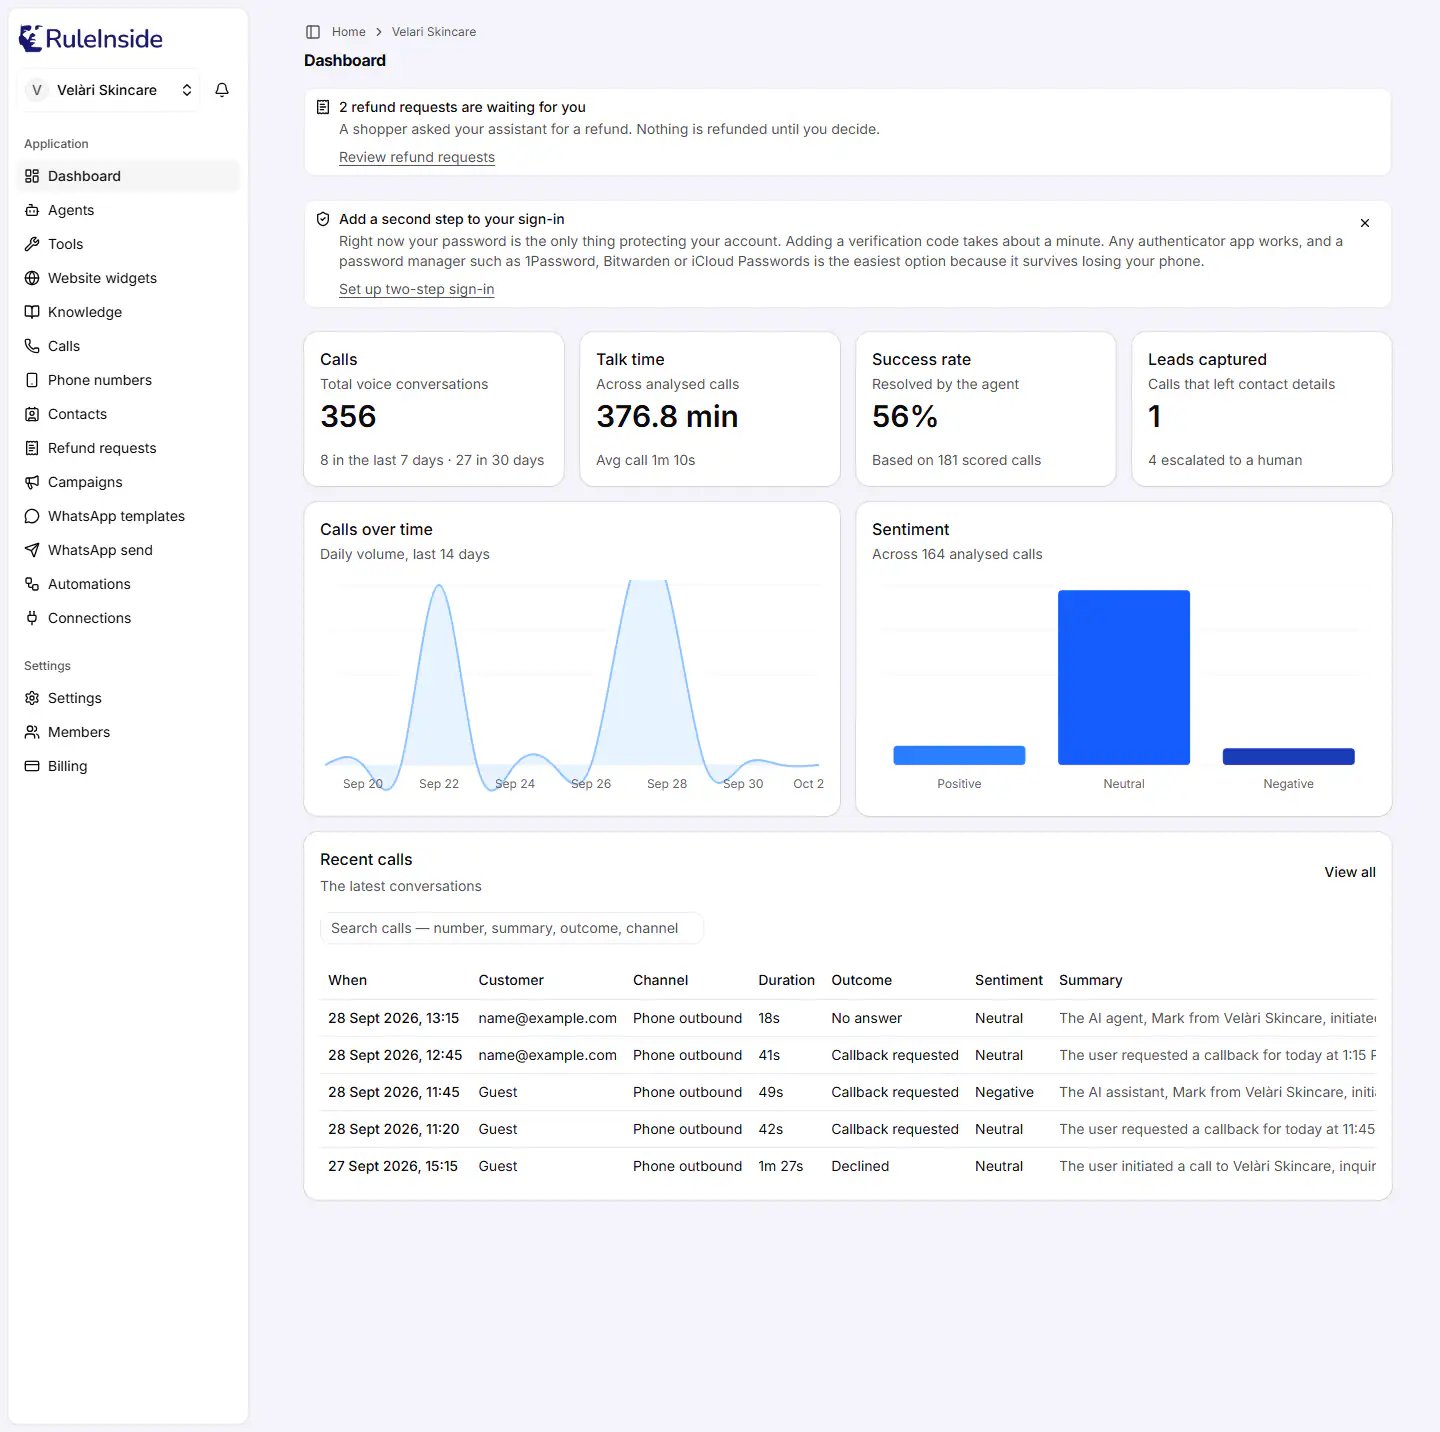
The Dashboard of a live store, with the four figures, the two charts and the recent calls.
Who can see it
Every member of your team can see the Dashboard. Nothing on it changes your settings or your data: it only shows figures and links to other pages. The figures cover your whole store, all agents together. Unlike the Calls and Phone numbers pages, the Dashboard has no Agent selector.Before your agent is live
Until your subscription is active and your agent is set up, the Dashboard shows a single card instead of the figures.
Once the subscription is active and your agent is set up, the full Dashboard below appears.
Notices at the top
Notices appear above the figures in a fixed order: first anything that has stopped, then work waiting for you, then a suggestion.1
Calling consent
“Outbound calling is paused” (red) means your account cannot place automated calls until you confirm you have
a lawful basis for calling the people you want contacted. Nothing is sent in the meantime. Press Review and
confirm to go to the calling consent confirmation in Settings. This notice cannot be dismissed: it disappears
once you have confirmed.“Please re-confirm” (neutral) means the wording of the calling consent confirmation has changed. Your calls
are still running. Press Review and confirm to read the new wording and confirm again. See
How calling rules protect your customers.
2
Refund requests
“A refund request is waiting for you” (or “N refund requests are waiting for you”) appears when at least one
shopper has asked your assistant for a refund that you have not decided yet. Nothing is refunded until you
decide. Press Review refund requests. See Refund requests.
3
Two-step sign-in
“Add a second step to your sign-in” suggests protecting your login with a second step. Press Set up
two-step sign-in to do it, or the X to hide the suggestion. Hiding it is remembered only in that browser,
so it can appear again on another computer.
The four figures
The four figures count every call RuleInside has recorded for your store, for all agents and all time.Calls
- Title: “Calls”, subtitle “Total voice conversations”.
- Big figure: the total number of calls.
- Line underneath: for example “12 in the last 7 days · 48 in 30 days”.
- Period: the 7 and 30 days are rolling. They count back exactly 7 x 24 hours and 30 x 24 hours from the moment you opened the page, not from the start of the week or month.
Talk time
- Title: “Talk time”, subtitle “Across analysed calls”.
- Big figure: for example “84.5 min”: the total length of your analysed calls in minutes, with one decimal place.
- Line underneath: for example “Avg call 1m 10s” or “Avg call 45s”: the average length of a call.
- How it is counted: only calls with a recorded length between zero and one day count. When no call has a recorded length, the figure shows a dash.
Success rate
- Title: “Success rate”, subtitle “Resolved by the agent”.
- Big figure: a whole-number percentage.
- Line underneath: “No scored calls yet”, “Based on 1 scored call” or “Based on 181 scored calls”.
- How it is counted: after each call, the call is automatically scored as success, failure or unknown. The rate is the number of successful calls divided by the number of calls scored success or failure. Calls scored unknown, and calls not scored, are left out of both. When there are no scored calls, the figure shows a dash.
The success rate measures whether the agent achieved the goal of the call. It is not a count of sales.
Leads captured
- Title: “Leads captured”, subtitle “Calls that left an e-mail address”.
- Big figure: the number of calls in which the agent captured an email address.
- Line underneath: for example “3 escalated to a human”: the number of calls whose outcome was “escalated”, meaning the call was handed to a person or transferred.
The two charts
Calls over time
- Title: “Calls over time”, subtitle “Daily volume, last 14 days”.
- What it shows: an area chart with one point per day for the last 14 days, including today. Hover over a day to see its number of Calls. Days with no calls show 0. When space is short, not every day label is printed.
- How days are counted: calls are grouped by calendar day in UTC (Coordinated Universal Time), not in your local time. A call made just after midnight in your time zone can therefore appear on the previous day.
Sentiment
- Title: “Sentiment”, subtitle “No analysed calls yet”, “Across 1 analysed call” or “Across N analysed calls”.
- What it shows: three bars, “Positive”, “Neutral” and “Negative”: how many calls the agent judged in each mood after the call.
- How it is counted: the subtitle number is the sum of the three bars. Calls with no sentiment are left out.
Recent calls
Title “Recent calls”, subtitle “The latest conversations”. It lists the 5 most recent calls of your store, all agents together, newest first. Press View all to open the Calls page, or a call’s date to open that call. It has the same columns as the Calls page (When, Customer, Channel, Duration, Outcome, Sentiment, Summary) and a search box, with a few differences:
The search box filters only these five rows. Calls are not grouped into visits here, and there are no Newer or
Older buttons.
Errors and notices
Common questions
Why do the Dashboard and the Calls page show different numbers?
Why do the Dashboard and the Calls page show different numbers?
They count different things. The Dashboard counts every call RuleInside has recorded for your store, all
agents together, over all time. The Calls page reads the live call log for the one agent
selected at the top, and groups calls into customer visits. It also shows no total. The two will not match
exactly. For your total number of calls, use the Dashboard’s Calls figure.
Why does Leads captured show fewer leads than I expected?
Why does Leads captured show fewer leads than I expected?
Leads captured counts the calls that left an email address. A call in which the agent captured only a
phone number, or only what the customer was interested in, is not counted. Open a call and look under Data
collected to see everything the agent captured.
Is "last 7 days" this week?
Is "last 7 days" this week?
No. It is the last 7 x 24 hours, counted back from the moment you opened the page. The same applies to 30 days.
Why does the chart show a call on the wrong day?
Why does the chart show a call on the wrong day?
The chart groups calls by UTC calendar day, not by your local day. A call made shortly after midnight in your time
zone can appear on the previous day.
Why is the success rate based on fewer calls than my total?
Why is the success rate based on fewer calls than my total?
Only calls scored success or failure count. Calls scored unknown, and calls that were not scored, are left out.
The line under the figure tells you how many calls it is based on.
What does "escalated to a human" count?
What does "escalated to a human" count?
The calls whose outcome was “escalated”: the agent handed the customer to a person or transferred the call.
Why does the whole Dashboard show an error instead of the figures?
Why does the whole Dashboard show an error instead of the figures?
A figure could not be read at that moment, and the Dashboard does not show zeros in its place. Press Try
Again. If the error persists, contact support.
Can I hide the "Outbound calling is paused" notice?
Can I hide the "Outbound calling is paused" notice?
No. It disappears once you confirm the calling consent in Settings, using Review and confirm.
Where did the two-step sign-in suggestion go?
Where did the two-step sign-in suggestion go?
Either you hid it with the X in this browser, or you have set up a second sign-in step.
Can I see one agent's figures on their own?
Can I see one agent's figures on their own?
Not on the Dashboard: it always covers all your agents together. To look at one agent’s calls, use the
Calls page and choose the agent at the top.